
Before you start
Many pull-up plans go wrong in a quiet way. Nothing breaks. You just stop learning from your sessions, because you cannot tell what any of them was worth.
This page tells the story of an app that tries to fix that, and of the study that will test whether it can. It is written to be read, not skimmed. It is also honest about what is proven and what is not.
6×4 means six sets of four reps. 5 5 4 4 4 means five sets: two of five, then three of four. A strict rep means full range, no kipping.
Everything below carries one of these tags, so you can see how much weight a statement can bear.
01 · The problem
Three sets of ten, and why it quietly wins
The classic plan is three sets of ten. You can remember it. You can write it on a whiteboard. Next week you can do it again and see whether it felt easier.
It hides a problem. The plan only works if ten reps is the right amount for you, today. For pull-ups that is a big if. If your limit is seven, ten is a wall. If your limit is twelve, ten is a warm-up.
So people adapt by hand. A rep here, an extra set there, a shorter rest when time is tight. Doing that every session is tiring, so most of us end up guessing.
The deeper trouble arrives a few weeks later. You did 6×4 on Monday and 5 5 4 4 4 on Thursday. Which was harder? Which one counted for more?
Same athlete, two sessions
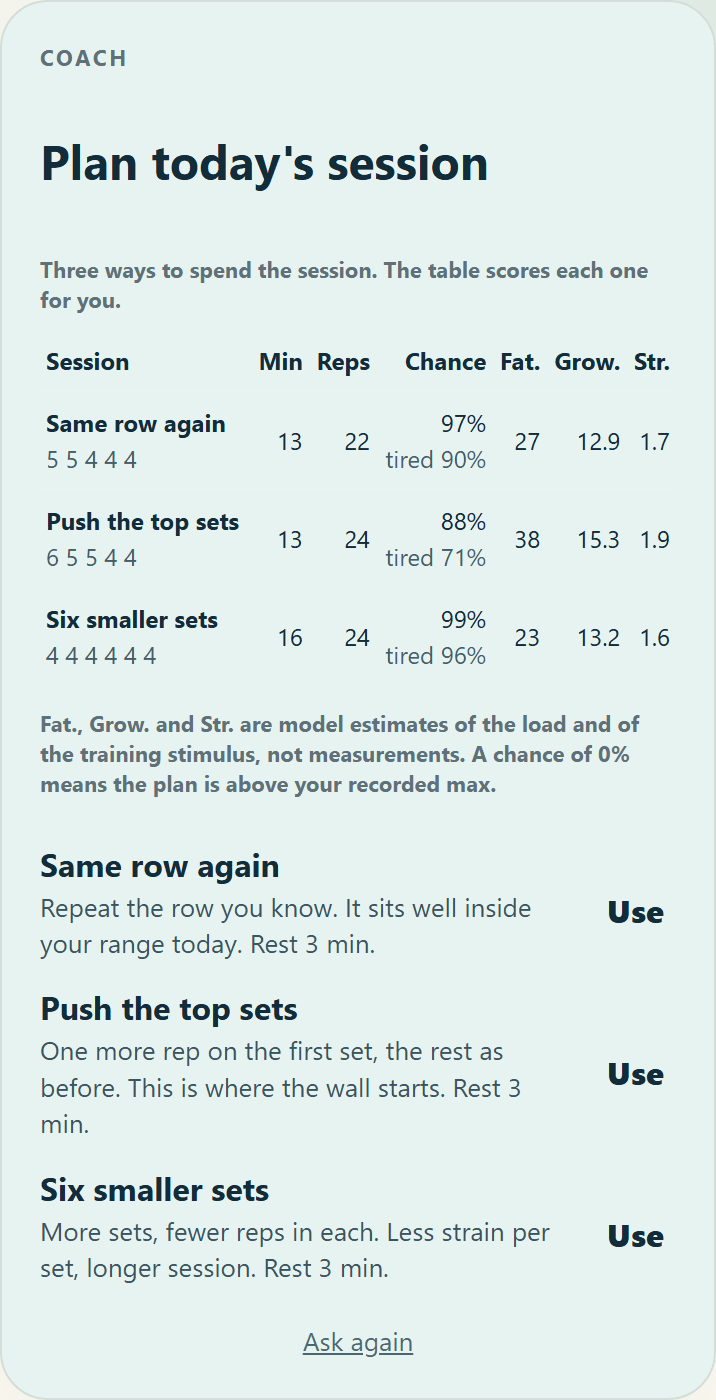
Add up the reps and 6×4 wins, 24 to 22. But the model says it costs less, 23% against 27%, because the two 5s in the other session sit closer to the limit. It also takes longer. A rep count alone cannot tell these days apart.
An app that can do the arithmetic can. It can turn any session, whatever its shape, into the same few numbers: what it cost you, how likely you were to finish it, and what it says about what you can do right now.
That is what the title means. A session counts when it can be compared with every other one.
02 · A real climb
From 3 3 3 2 2 to 6×4
The goal is 15 strict pull-ups in a row. The builder of this app began with 3 3 3 2 2, thirteen reps in five sets. The app climbs one rep at a time: finish a row cleanly and the next one adds a rep.
Along the way came 4 3 3 3 3. Then 5 5 4 4 4, which was the app’s plan on the day this page was written. The session that went in the log was 6×4.
The ladder, one rep per step
- 133 3 3 2 2Start
- 143 3 3 3 2
- 154 3 3 3 2
- 164 3 3 3 3On the way
- 174 4 3 3 3
- 184 4 4 3 3
- 194 4 4 4 3
- 205×4
- 215 4 4 4 4
- 225 5 4 4 4Plan, 30 Oct
- 235 5 5 4 4
- 246×4Logged, 30 Oct
splitSets, figures.json › ladder.Look at the top of the ladder. The steps look the same size. They are not. Each new rep lands on a set that was already hard. That is where the next chapter begins.
03 · The wall
The last rep costs more than the first
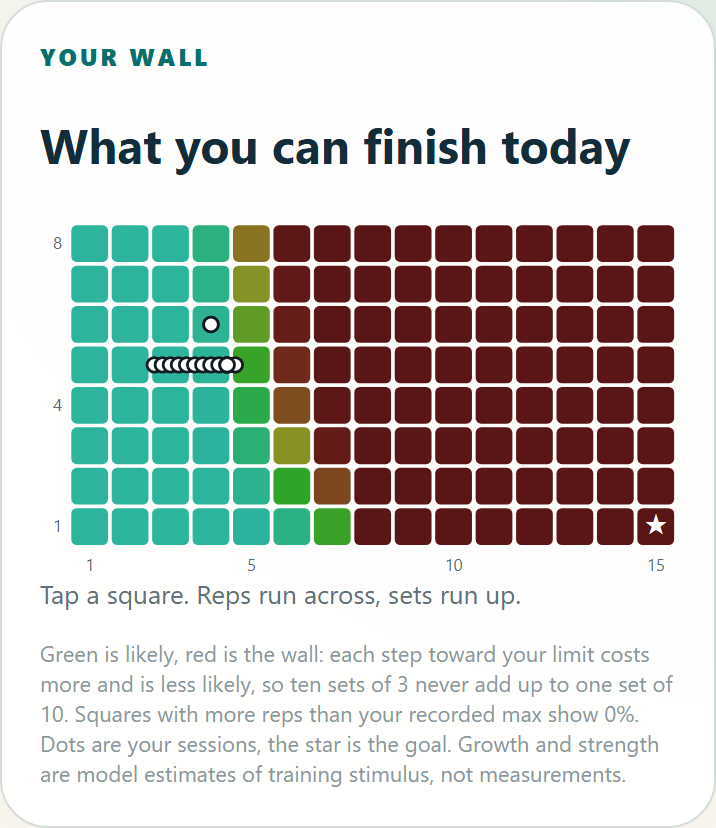
Every lifter knows this. Four sets of four feel fine. Four sets of six feel impossible. The change is not gradual.
The model puts a number on it. For an athlete whose best is 7, here is the chance of finishing, as the sets get heavier.
Chance of finishing the whole session
- 1 set
- 4 sets
- 6 sets
Four sets of 4 are close to certain. Four sets of 5 are 91%. Four sets of 6 are 17%. Four sets of 7 are under 1%. One rep per set moves you from comfortable to a long shot.
Why ten sets of 3 never add up to one set of 10
Reps are not interchangeable. Three reps from a fresh athlete cost almost nothing. The tenth rep of a set of ten costs a lot.
Ten sets of 3
fatigue at the end. 30 reps, but about 29 minutes, mostly resting.
One set of 10
fatigue at the end. 10 reps, half a minute. A 71% chance, even for a max of 10.
Athlete with a max of 10, 84 kg, 3 minute rests. Fatigue is the model’s estimate of capacity lost by the end of the last set. Source: figures.json › wall.tenVsOne.
A good day and a tired day
The builder put it plainly while testing: 5 5 4 4 4 can be finished on a good day and not on a tired one. The engine agrees, and it puts numbers on it.
“Tired” here means the same athlete is 10% weaker from the first set. The whole session is worked out again for that weaker athlete.
5 5 4 4 4, by the athlete’s max
At a max of 6 the same session is 69% likely on an ordinary day and 8% on a tired one. Move the max up one rep and the ordinary day becomes 99%. At 7, being tired barely matters. At 6 it decides everything.
The wall is real, but where it sits is soft. Near it, the answer depends on constants nobody has measured on pull-ups. Change the cost of a failed set by 25% and that 69% becomes 44% or 86% (validation report, section B2). Far from the wall, nothing moves much. Assumed
04 · Rest between sets
What the rest does, and what it doesn’t
“Long rest is part of the workout.” From the app’s rest screen.
Your muscles do not reset between sets. Some of the tiredness fades with rest. Some of it stays for the rest of the session.
The model keeps two piles of fatigue. The fast pile clears with rest: about two thirds of it every two and a half minutes. The slow pile, 12% of the cost of a set, stays all session. Assumed
How good is that picture? Published recovery curves come from cycling and from thigh muscle, not from pull-ups. Here is the model next to two of them.
Cost of a failed set still there after resting
- The model
- Two-phase fit, trained cyclists
- Single-rate fit, 21 men
From about 3 minutes, the model tracks the published two-phase curve closely. Below 2 minutes it recovers too slowly. Most sessions rest 3 minutes or more, so we kept it, and said so. The papers also suggest about half the recovery is slow, not the 12% we assumed. Borrowed
The set that felt easier
The builder noticed something odd. After a big set, a smaller set at the same 3 minute rest can feel easier than the set before it.
The model can reproduce that. Take a max of 8 and sets of 8, 5 and 3. This is the capacity the athlete has before each one.
8 reps
5 reps
3 reps
It rises from 6.52 to 6.57. That is five hundredths of a rep, well inside the day-to-day noise in how many reps anyone can do. The only repeat-test data we found, on the bench press, show a typical error of 0.7 to 1.1 reps (Mitter 2022).
Flat is plausible. In one study at 5 minutes rest, about half the exercises showed no loss in reps across the sets (Senna 2009).
Higher has no direct support. We found no study showing more reps after a smaller set at 2 to 3 minutes rest. A different effect, potentiation, can briefly raise power after hard effort, but it is about power, not reps, and shows up mostly at longer rests (Wilson 2013).
So the app does not show this as a finding. It is something the maths allows. Assumed
05 · Measuring instead of guessing
Ask, watch, or guess. We try to avoid the third.
Everything above needs numbers about you. The app gets them three ways, and each one is something you can see on the screen.
-
A calibration day
Four all-out sets, about 20 minutes: three bodyweight sets, resting until you feel ready, then one with weight added. It measures your max, how much of it you keep for the second set, and a first look at strength.
-
“I’m ready” taps
During a rest, tap the moment you feel ready. The app stores the seconds you actually rested, instead of assuming three minutes.
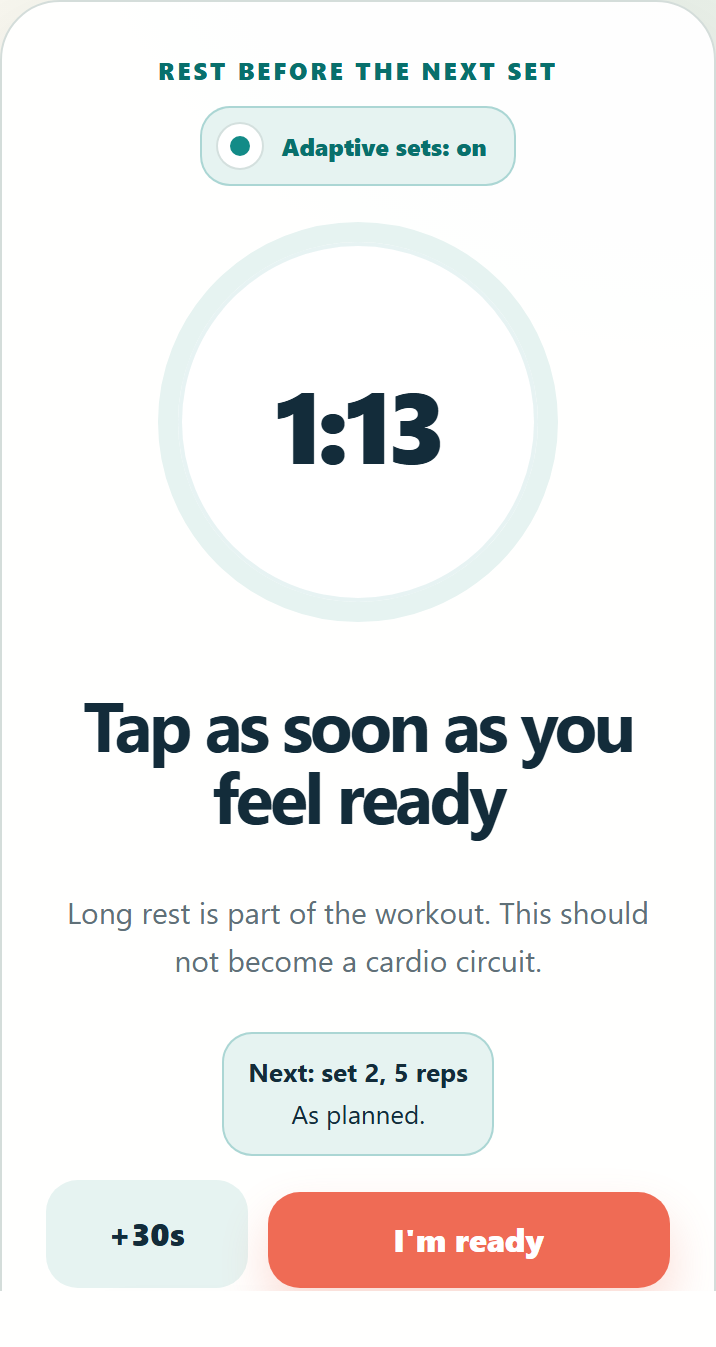
Rest you choose yourself works about as well as a fixed 3 or 5 minutes, and it creeps up through a session, by about 70 seconds from the first set to the fourth in one squat study (Ibbott 2019). It is also only fairly repeatable from one day to the next (Ibbott 2019 (self-selected rest)). So we record it, and never treat it as a fixed trait of yours. Borrowed
-
Effort ratings
After each set you say easy, normal, hard or failure. People tend to have about a rep more left than they say: when you report “one left”, you often had two (Halperin 2022, 0.95 reps on average, with wide spread). So the app reads a rating as a noisy hint, not an exact count. An “easy” says only that there was plenty left. A set that ended because the next rep failed says far more, and is treated differently. Borrowed
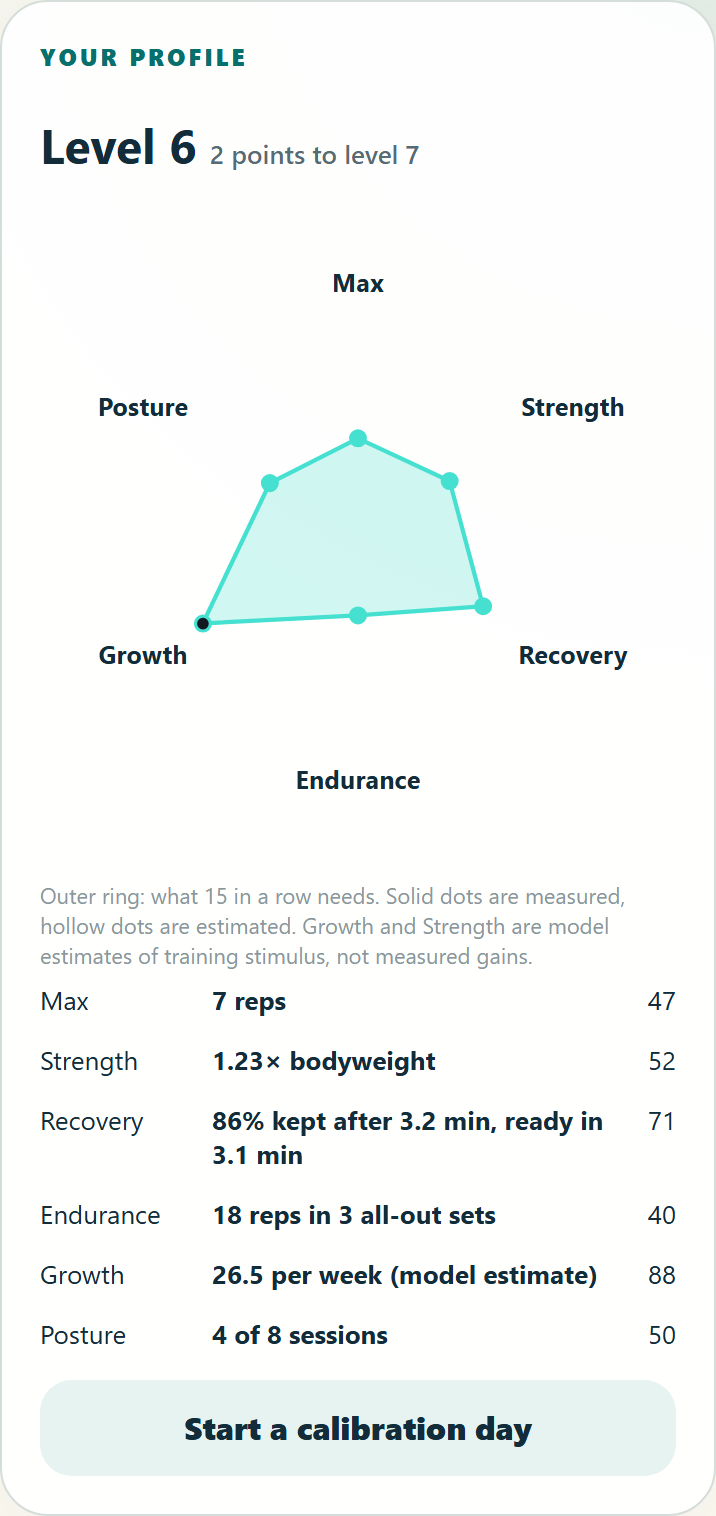
Six markers on one picture
Put together, the data give six markers of where you stand against the goal of 15. Four of them are measured on a calibration day and are estimates until then.
- MaxCalibration
Best strict reps on a calibration day, or an estimate until you do one.
- StrengthCalibration
How heavy a single rep you could manage, as a multiple of bodyweight, from the weighted set.
- RecoveryCalibration
How much of your first set you keep in the second.
- EnduranceCalibration
Total reps in the three all-out sets, against three sets of the goal.
- GrowthEstimate
A model estimate of training stimulus per week. It is never measured muscle growth.
- PostureLogged
Sessions where you did the posture work, out of eight in four weeks.
06 · True max
One number that survives a change of shape
Ask ten lifters for their max and you will get ten answers from ten different days. A personal record only goes up. It says what happened once, not what you can do now.
The app keeps the record, and adds a second number: the true max. It is the number of strict reps you could do fresh today, with a band around it that says how sure we are.
Every set you log updates it, whatever the shape of the session. A 6×4 day, a 5 5 4 4 4 day and a weighted day all speak to the same number, because each set is converted into “what max would make this likely?”.
Not all sets say the same amount. A set that ended because the next rep failed says a lot. A set you rated easy says little. The band widens when you have not trained for a while, and the estimate can fall as well as rise.
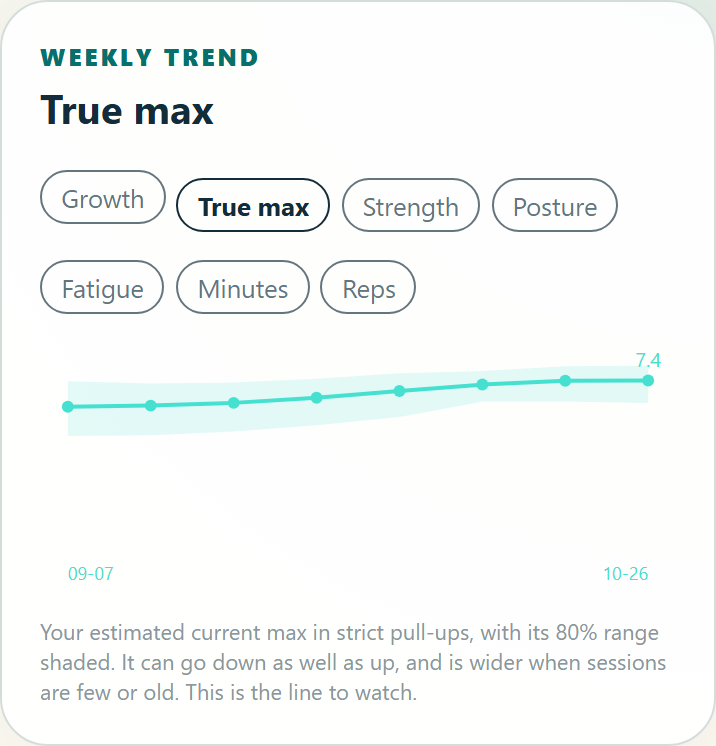
This split has a history. At one point the app believed the builder’s max was about 5, while the log already showed 6×4. A record set weeks earlier had gone stale, and the model called 6×4 impossible. It was not. That is why the record and the estimate are now kept apart.
07 · How we checked it
Being hard on ourselves, four ways
A model can be wrong in its assumptions, in its structure, in its code, or in how it meets real data. We looked at each.
1. What the papers say
We checked the model’s key constants against published work. Almost none of it is about pull-ups. Where the papers disagreed with our first version, we wrote it down. This is the scorecard.
-
Reps to weight: the Epley rule
- We assumed
- The Epley rule: every rep you manage at a weight adds a thirtieth of that weight to your estimated one-rep max.
- The papers say
- The slope is right. The level is off. In a public dataset of 84 people doing pull-ups, the rule predicted about 2 fewer reps than they managed, and overstated their one-rep max in 80 of 84 (Bayonas dataset 2025).
- What we did
- Kept the 30 as a shape, fixed an edge case so one rep sits at the one-rep load, and flagged the weighted days as the weak link.
-
How fast the cost climbs near failure
- We assumed
- Cost grows with the cube of how close to your limit the set is.
- The papers say
- Failing is clearly costlier (Pareja-Blanco 2020, Moran-Navarro 2017), but the numbers we could work out point to a power of 1.1 to 2.4, not 3.
- What we did
- Kept 3 as a labelled starting guess. Fitting it to each person is on the list.
-
Recovery between sets
- We assumed
- One fast recovery, plus 12% that never recovers within a session.
- The papers say
- Recovery has two phases, but about half of it is slow, not 12%. From 3 minutes our curve fits well.
- What we did
- Kept it for 2 to 5 minute rests. The 12% stays a guess.
-
The growth and strength scores
- We assumed
- A strong reward for reps close to failure, and a steep reward for heavier loads.
- The papers say
- Our reading, with low confidence: the reward for nearness to failure is probably two to seven times too steep (Robinson 2024, Refalo 2024), and the load reward is too steep as well (Lopez 2021).
- What we did
- Left the numbers, changed the labels: Growth and Strength are now called model estimates of training stimulus, and the coach is told never to chase them alone.
-
Effort ratings
- We assumed
- “Hard” means exactly one rep left, “easy” means exactly four.
- The papers say
- People under-report what is left by about a rep, and vary a lot (Halperin 2022).
- What we did
- Changed the model. A rating is now a noisy hint with a built-in bias, and “easy” has no upper limit.
One direct pull-up trial exists (Sanchez-Moreno 2020). It found that stopping sets at 25% velocity loss beat 50%, and that gap did not reach max reps. It does not validate any of our growth numbers.
2. An independent review by an AI
We asked Codex ASTRA, a language model, to review the specification, the literature check, the validation report and the code, as an independent scientist would. It ran no new measurements. Its opinions are opinions, not data. Its verdict on the first version:
The model is a useful engineering prototype, but it is not yet a validated measurement model or a scientifically established training optimiser.Codex ASTRA, independent review of model 0.25
It found real problems. Fatigue was being read after a rest that never happens. The tired-day figure was a shortcut, not a re-run. The session chance was the lowest of the set chances, not a joint probability. Forecasts were made when you saved, after the session, so they were not really predictions. And the max could only go up.
Version 0.26 fixes the first seven items on the reviewer’s ranked list. The rest need data we do not have yet.
3. The software
We rewrote the whole model in Python from the written specification, then compared it with the app’s own code. We also broke each constant on purpose, to see whether the comparison would notice.
Checked Zero differences means the written spec and the code agree. It does not mean the spec describes a body.
The Python and the TypeScript share an author and were written in the same session. Agreement rules out slips and typos. It rules out a shared misunderstanding only where the two disagree. The one independent piece is the routine that computes the normal curve.
4. Made-up athletes
If we invent athletes with a known max, feed the model their logs, and ask it to find the max, how close does it get?
Simpler readings did worse: the first set of the last session missed by 1.59 reps, the record by 0.62, the starting test by 0.73. Simulated
Then the real test. What if the world does not follow the model? The band is supposed to catch the truth four times in five.
How often the 80% band held the truth
80% is what a well-judged band should reach
- AThe model's own world
- BAthlete reports effort exactly
- CAthlete under-reports by 2 reps
- DTrue fatigue scale 0.7, model assumes 1
- ETrue fatigue scale 1.4, model assumes 1
- FWorld has exponent 2 and tau 120
- GImproving 0.08 reps a day
- HDrops 2 reps after session 7
- IEvery third day loaded +5 kg
- JEasy sets only
When the fatigue assumption is wrong, the model is over-confident. When an athlete improves fast, it lags behind, though it still beats the old record and the starting test in those cases. Both problems are on the list to fix.
The made-up athletes are generated by the same equations the model uses. That checks the software and whether the maths can recover what it assumed. It cannot tell us that real athletes behave this way.
08 · One disagreement, in the open
Is it fair to say 0%?
The reviewer and the builder disagree about one thing, and we kept both sides.
The builder’s rule: if a plan asks for more reps in a set than your recorded max allows at that load, the app shows 0%. A set above your known max should not look like a good idea.
The reviewer’s objection:
If the display must literally say “0% chance” above any recorded maximum, that requirement is incompatible with an honest probabilistic model. Calling it a policy score would resolve the conflict; retaining the probability label would not.Codex ASTRA, section D3
It has a point. A record is what happened once. It is not a ceiling. Here is an athlete with a recorded max of 7 whose true capacity is probably nearer 9, planning 8 reps, then 7:
The app shows
Above the recorded max, so the plan is flagged hard.
The model says
53% on a tired day. This is what the study stores and scores.
Source: figures.json › gate (the engine, recorded max 7, plan 8 then 7, capacity spread around 9).
So the app does both. The screen shows 0%, as asked. The uncapped probability is stored with every forecast, and that is the one scored in the study. If your last max test is more than 42 days old, the app still shows 0% but says the max may be out of date and suggests a calibration day.
We call it what it is: a prescription rule, not a probability. The note under the coach table says so in plain words: a chance of 0% means the plan is above your recorded max.
09 · What happens next
The test the model still has to pass
Everything in this chapter is a plan. The schedule is proposed and has not started. No result exists. No ethics review has been done.
The study asks one narrow question: does the model estimate and predict strict pull-up performance, across different session shapes, in one person?
If it starts as planned, the first real numbers arrive after about six weeks, and the confirmatory run after about 22.
It does not ask whether the coach beats a fixed programme. It does not test growth, strength, overtraining, or whether every session contributes to progress. One person cannot answer those.
How it would run
- One adult, the app’s builder, who is also the investigator. That is a conflict of interest, and the protocol says so.
- About 22 weeks, two sessions a week: 40 sessions in all. Two for practice, 9 reference tests, 29 forecast sessions, and a planned two-week break.
- Session shapes in random order: a few hard sets, five sets, many easy sets, short rests, long rests, a loaded day.
The two things being scored
A reference test. One all-out set of strict bodyweight pull-ups, filmed from the side. A second person counts the reps from the video, without seeing the forecast. The model’s forecast of that count is written down first.
The primary outcome: how far the forecast lands from the count, averaged over the last 6 tests. The comparison is the simplest guess there is: same as last time, the latest test carried forward.
Every planned session. Before the first rep, the app writes down its chance of finishing every set, and locks it. Afterwards it is scored with a Brier score (Steyerberg 2010).
A Brier score is the average squared miss between the chance you gave and what happened, counting a finish as 1 and a miss as 0. Lower is better. Always saying 50% scores 0.25.
Predictions written down in advance
Eight predictions are fixed before any data exist. Four of them, in plain English, each with the chance it fails even if the model is right:
- The model beats “same as last time” by at least 10% on average.Fails 32% to 68% of the time even if the model is right. Six tests are too few for more.
- No lean: forecasts are not too high or too low on average, within three quarters of a rep.Fails about 3% of the time if the model is right.
- Honest ranges: at least 4 of 6 results inside the 80% band and 5 of 6 inside the 95% band.Fails 13% or less of the time if the model is right.
- Session chances beat the base rate: a Brier score of 0.20 or better, and better than simply using the share of sessions finished so far.Fails about 9% and 5% of the time if the model is right.
Four more cover calibration overall, the top and the middle of the scale, and beating a first-set reading. Source: protocol section 10.
What would count as failing
The model is declared not supported if any one of these happens. They are written before the first test and cannot be changed after:
- the average error on the six tests is above 1.5 reps;
- the session Brier score is above 0.25, worse than always saying 50%;
- a session is finished in full although its stored chance was under 1%;
- two or more misses among sessions given 95% or more.
Three more are in the protocol. A model that can always explain a miss by changing its “true max” afterwards cannot be tested. That is why forecasts are locked before the event.
The proposed schedule
- Freeze, then practise
The protocol is frozen before the first baseline test. A planned freeze date is 8 November.
- Three baseline tests
They show the starting level and how noisy the test itself is.
- First scored test forecast
About six weeks in, the first real comparison of forecast and count. It is descriptive only.
- A planned two-week break
The model has to cope with time off.
- Data lock, then the confirmatory result
About 22 weeks in. This is when the answer is read, and the report follows two weeks later.
With six tests the study can spot a gross failure. It cannot confirm a 10% improvement with confidence. Even a perfect forecast of the max would miss by about 0.6 to 0.7 of a rep if the test is as noisy as the model assumes. The study also cannot tell us anything about anyone else.
Ethics: no review has been done. It is a self-experiment by one person. A review or a documented waiver would be needed before anyone else joins, before any result goes to a journal that asks for one, and before any larger trial.
10 · What we do not know yet
The honest list
- How it works on people.No prospective human results exist. Everything on this page is software checks, simulations and other people’s papers.
- Whether Growth and Strength mean anything.They are model estimates of training stimulus. Nobody has measured muscle size or strength against them.
- Any constant measured on pull-ups.None of the constants that change a number you see was measured on pull-ups. Three were fitted to two published totals for machine and press exercises. The rest are guesses, conventions or safety limits.
- Where the wall really sits.Near the limit, the chance depends on the weakest constants. A 25% change in one of them moves a session from 69% to 44% or 86%.
- Weighted days.Added load is predicted with a rule from other lifts. In the public pull-up data, that rule is off by about 2 reps.
- Everything outside the gym.Sleep, stress, food, soreness and injury are not in the model.
- How noisy a test really is.We found no repeat-test study for pull-ups. The study will measure it, and six tests can only go so far.
- Whether every session counts.The title is a design aim, not a result. For one person, nobody can show that each session adds to progress, and the study does not try.
That is the state of things. If the study runs, its results will go in the same place, whichever way they fall.
For the curious
The maths in short
Plain notation. B is bodyweight, m your max, L added load, r reps, t rest in seconds. The full specification has every constant and a worked example.
Capacity at a load
capacity(L) = B (m + 30) / (B + L) - 30At no added load this is just m. It is the Epley line with the edge corrected.
Two piles of fatigue
cost = 0.48 × s × min(1, r / capacity)^3 fast pile: 88% of cost, times exp(-t / 150) after each restslow pile: 12% of cost, stays
s is a personal scale. Capacity before a set is its fresh capacity times (1 - fast - slow), never below 10%.
Chance of one set
P(finish) = Phi( (capacity + 0.5 - r) / sd )sd = sqrt(0.5) × max(0.7, 0.09 × capacity)
Phi is the normal curve. Half the spread is the day’s form, shared by every set. The other half is set-to-set noise.
Chance of a session
A joint probability. The session is worked out again for each of 15 values of the day’s form and for each plausible max, and the results are averaged. It is not the lowest set chance and not their product. The tired day repeats the whole path for an athlete 10% weaker.
True max
A grid from 0 to 40 reps in steps of a quarter. Between days it drifts by 0.15 reps per square root of days, with no assumed gain. Each set updates it: a verified failure, a rated stop, or an unrated stop each have their own likelihood.
The 0% rule
shown chance = 0 if r > capacity(L) at the recorded maxBrier score
mean of (chance - outcome)^2, outcome 1 if finished, else 0Where the constants came from
| Constant | Value | Status |
|---|---|---|
| Load line | 30 | Convention, Epley shape |
| Failure cost | 0.48 | Fitted to two published totals, other exercises |
| Slow share | 0.12 | Same two totals, effectively a guess |
| Recovery time | 150 s | Same two totals |
| Cost power | 3 | Prior; direction only from a paper |
| Day spread | 9%, at least 0.7 rep | Prior from bench press |
| Tired day | 10% weaker | A stress scenario, not a finding |
| Growth, strength | 0.15, 10, 0.75 | Priors, stimulus estimates |
References and how much of each we read
Only sources named in our literature check. The tag says how much of each was actually read. Abstract-only means the numbers come from the abstract and the paper may say more.
- Bayonas (Universidad de Murcia) and colleagues. 2025. Dataset “Relative Strength Ratio and 1RM in the prone-grip pull-up exercise”. Mendeley Data, v1. doi:10.17632/yf5xvycdn2.1 public dataset re-analysed
- Caen K, et al. 2021. Med Sci Sports Exerc 53(9):1911-1921. Recovery of W′ after exhaustion, 21 men. doi:10.1249/MSS.0000000000002673 abstract only
- Chorley A, Bott RA, Marwood S, Lamb KL. 2022. Eur J Appl Physiol 122(3):677-689. Bi-exponential recovery in ten trained cyclists. doi:10.1007/s00421-021-04874-3 abstract only
- Halperin I, Malleron T, Har-Nir I, Androulakis-Korakakis P, Wolf M, Fisher J, Steele J. 2022. Sports Med 52(2):377-390. Accuracy in predicting repetitions to task failure. doi:10.1007/s40279-021-01559-x abstract only
- Ibbott P, Ball N, Welvaert M, Thompson KG. 2019. Int J Sports Physiol Perform 14(7):980-986. Five sets of five squats with 3 min, 5 min or self-selected rest, 16 men. doi:10.1123/ijspp.2018-0480 abstract only
- Ibbott P, Ball N, Welvaert M, Thompson KG. 2019. Percept Mot Skills 126(3):546-558. Variability and impact of self-selected interset rest periods. doi:10.1177/0031512519835976 abstract only
- Lopez P, et al. 2021. Med Sci Sports Exerc 53(6):1206-1216. Network meta-analysis of load and strength gain, 28 studies. doi:10.1249/MSS.0000000000002585 abstract only
- Mitter B, Csapo R, Bauer P, Tschan H. 2022. PLoS One 17(5):e0268074. Bench-press repetitions to failure at 70, 80 and 90 percent of 1RM, two tests a week apart, 24 trained adults. doi:10.1371/journal.pone.0268074 read in full
- Moran-Navarro R, et al. 2017. Eur J Appl Physiol 117(12):2387-2399. Training to failure lengthens recovery by up to 24 to 48 h. doi:10.1007/s00421-017-3725-7 abstract only
- Pareja-Blanco F, et al. 2020. J Strength Cond Res 34(10):2867-2876. Time course of recovery from resistance exercise with different set configurations. doi:10.1519/JSC.0000000000002756 read in full
- Refalo MC, Helms ER, Robinson ZP, Hamilton DL, Fyfe JJ. 2024. J Sports Sci 42(1):85-101. Training to failure or stopping about two reps short, 18 trained adults. doi:10.1080/02640414.2024.2321021 abstract only
- Robinson ZP, et al. 2024. Sports Med 54(9):2209-2231. Estimated proximity to failure, strength gain and hypertrophy: a series of meta-regressions. Numbers come from the preprint (SportRxiv 10.51224/SRXIV.295), which may differ. doi:10.1007/s40279-024-02069-2 abstract only
- Sanchez-Moreno M, Cornejo-Daza PJ, Gonzalez-Badillo JJ, Pareja-Blanco F. 2020. J Strength Cond Res 34(4):911-917. Bodyweight pull-up training stopped at 25 or 50 percent velocity loss, 29 men. doi:10.1519/JSC.0000000000003500 abstract only
- Senna G, Salles B, Prestes J, Mello R, Simao R. 2009. J Sports Sci Med 8:197-202. Repetitions across sets at 2 and 5 min rest, upper body 10RM (the per-set tables were not visible). read in full
- Steyerberg EW, et al. 2010. Epidemiology 21(1):128-138. The Brier score for overall performance, with discrimination and calibration. doi:10.1097/EDE.0b013e3181c30fb2 abstract only
- Wilson JM, et al. 2013. J Strength Cond Res 27(3):854-859. Meta-analysis of post-activation potentiation. doi:10.1519/JSC.0b013e31825c2bdb abstract only
Also used: the model specification, the literature check, the independent review, the validation report and the study protocol, all kept in the project’s study folder. The review is opinion, and no number was taken from it unless named as its proposal.